Tools Used
- ArcGIS Pro
- Adobe Illustrator
Purpose
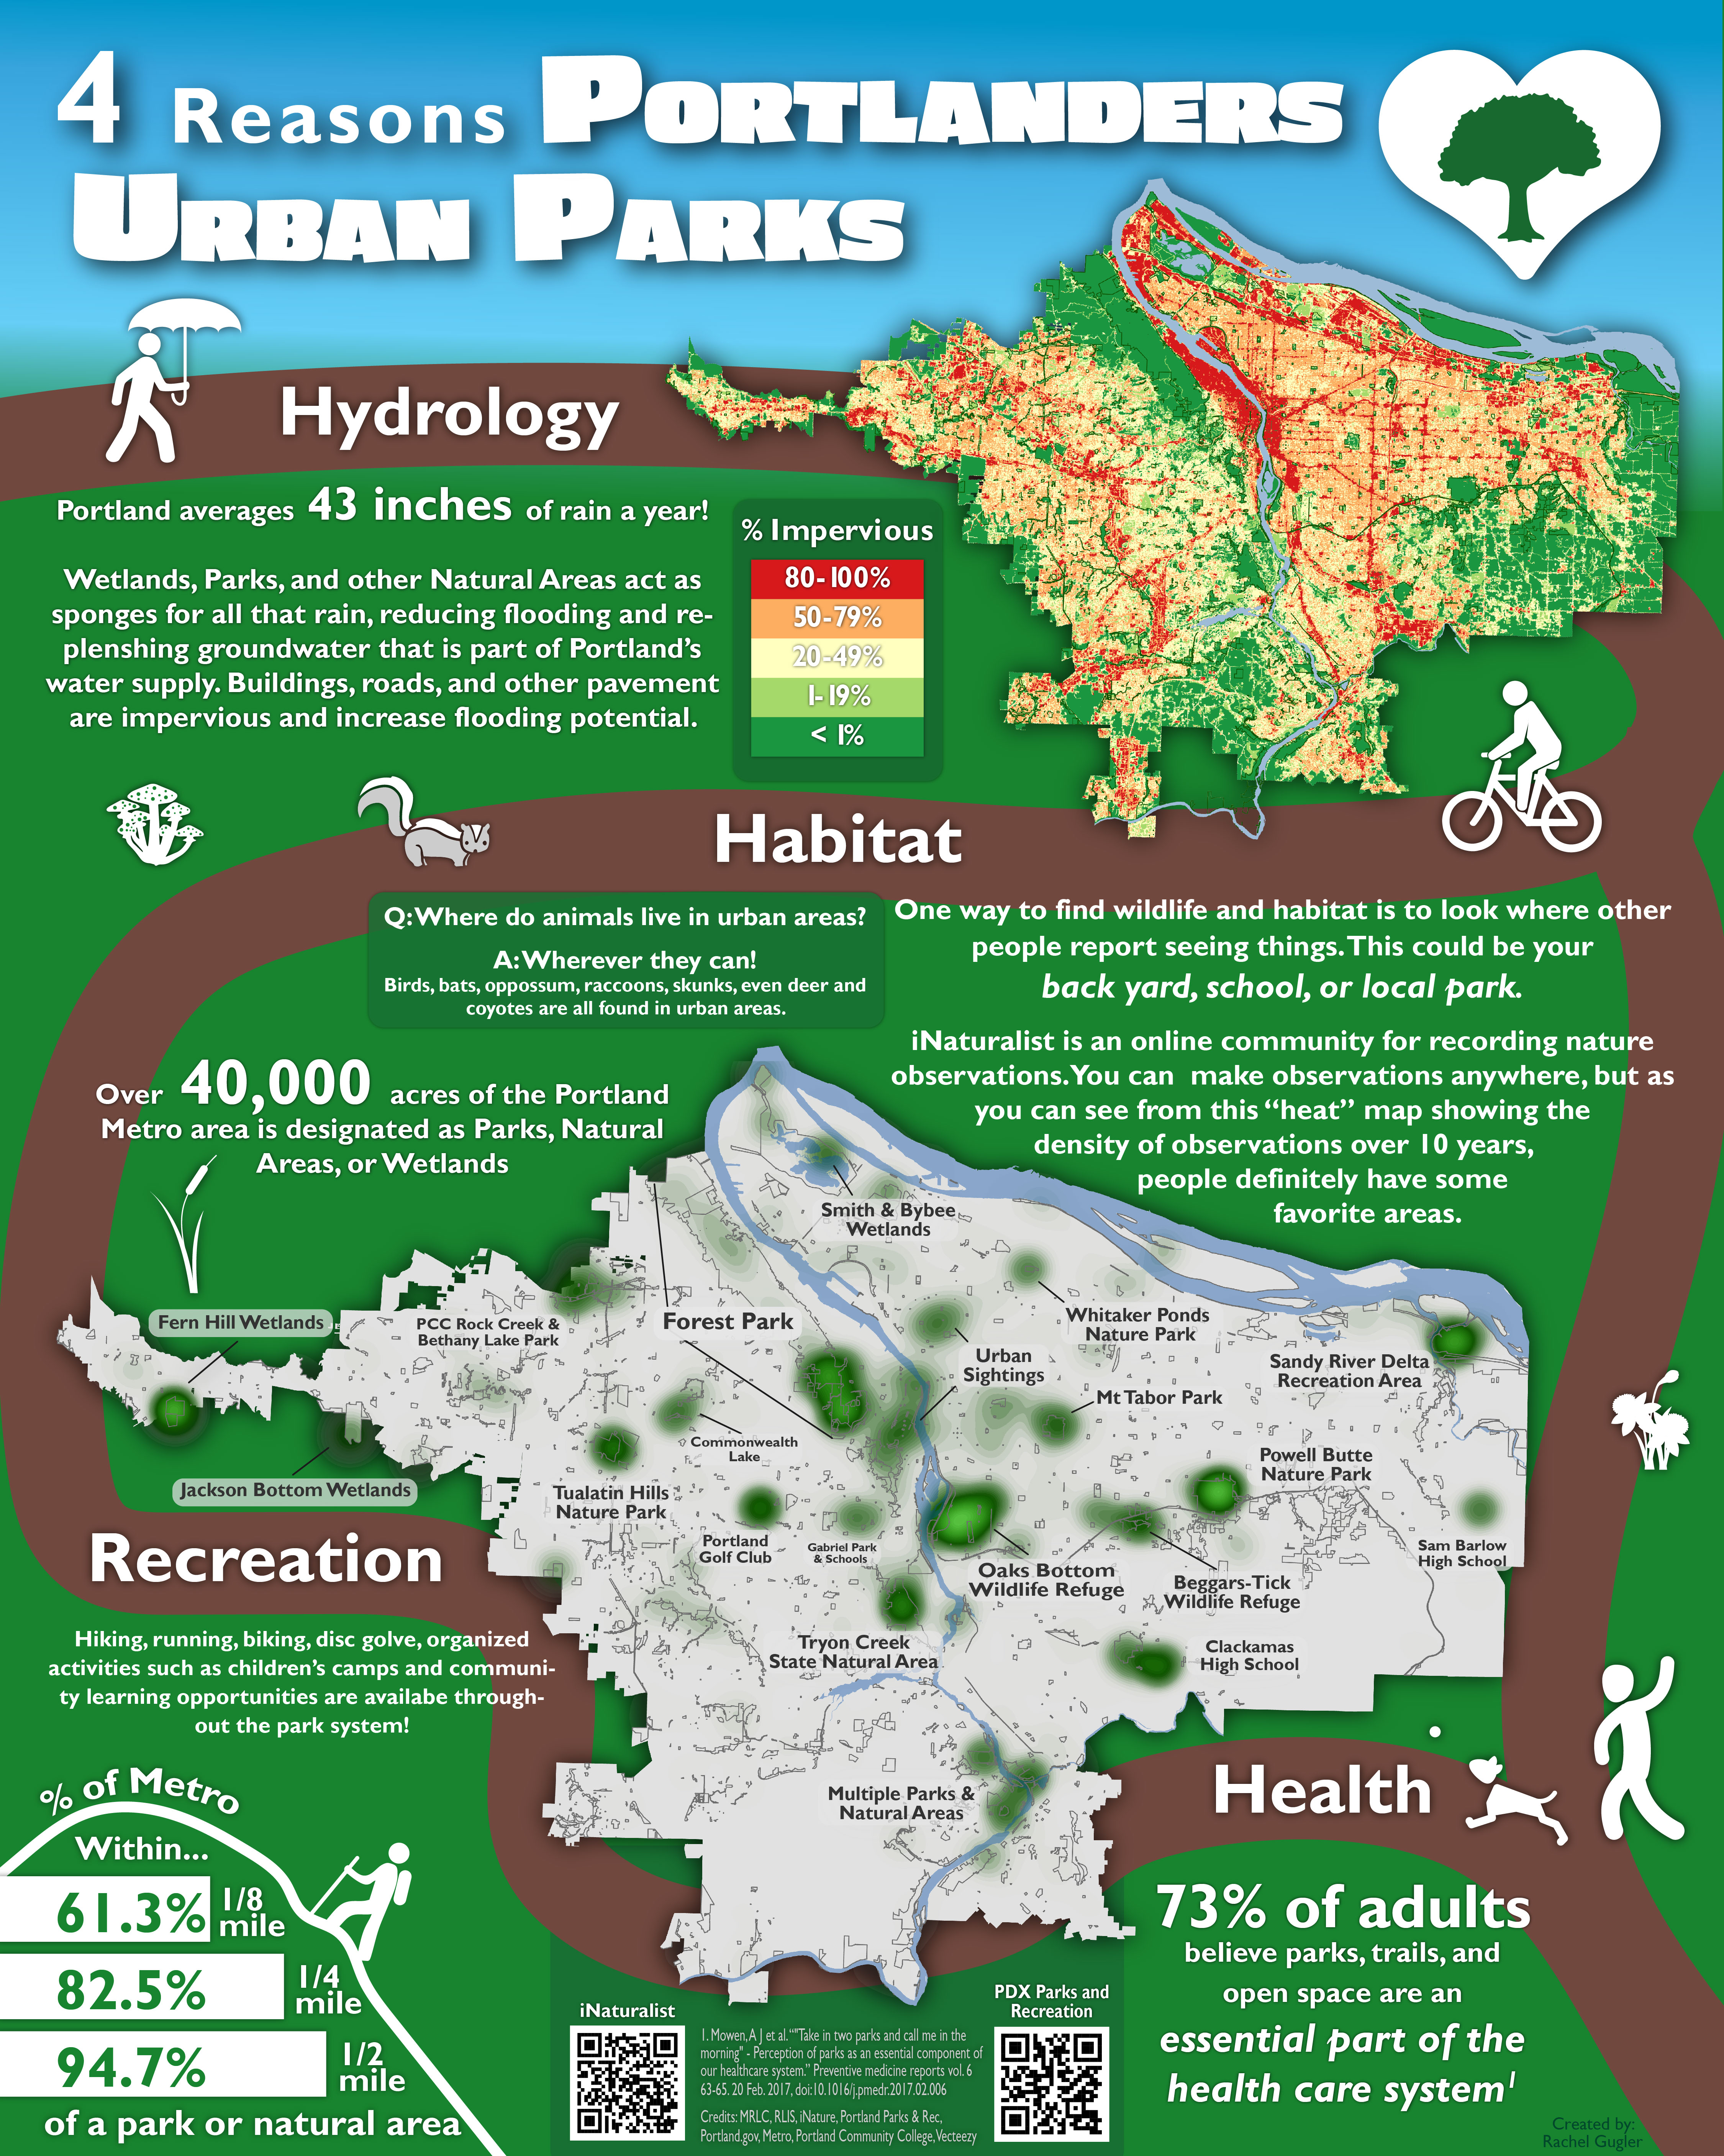
I created this infographic in my cartography class that was part of my GIS certificate from Portland Community College.
Methods
I created the maps using ArcPro. The assignment had a requirement for having 2 maps on the infographic. My first map shows areas that are impervious to rain, increasing flooding risks. The purpose of that map in the infographic is to show that parks are a valuable resource for permeable land for absorbing rain and other runoff.
The second map shows hotspots of sightings recorded in the iNaturalist community website. Community sightings of wildlife are historically very skewed and not good identifiers of a species true range, but they are excellent for identifying hotspots of where people go to watch wildlife. The map shows the desnity of observations over a 10 year period.
I included the rivers in both maps because they are a defining feature of the area.
The rest of the background and diagrams were made in Adobe Illustrator either from scratch or by finding free clip art online and modifying it as needed to fit into the style of the infographic.
Final Thoughts
Looking back at this several years later, I am still happy overall. I would make different choices regarding the layout of the title and fonts used for it, and I see some slight alignment issues with other text throughout the layout, but nothing that I would consider a catastrophic failure. I really enjoyed mixing creativity with cartography for this project.